Perinatal mortality rates
The figure below, upper panel, shows the trend of perinatal mortality in the study region, the prefectures Fukushima, Iwate, Miyagi, Gunma, Tochigi, Ibaraki, Chiba, Saitama, and Tokyo.
To reduce statistical variations, 3-month averages (quarter years) are displayed. The data points in the third quarter of 2008 are considered outliers and omitted from the regression.
The lower panel shows the corresponding rates in the control region, i.e. Japan minus the study region.
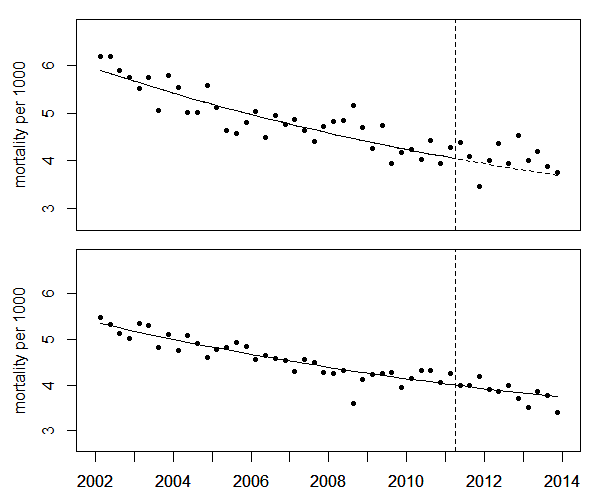
Perinatal mortality rates in the study region (upper panel) and in the control region (lower panel) and trend lines
To test the significance of the increase of perinatal mortality in 2012-13, the ratio of mortality rates in the study region to the rates the Japan minus the study region (odds ratios) is analyzed. A linear regression of the logarithms of the odds ratios - without the outlier in the third quarter of 2008 - yields a significant 11.2% increase in 2012-13 (P=0.009). The increase corresponds to 248 excess perinatal deaths.
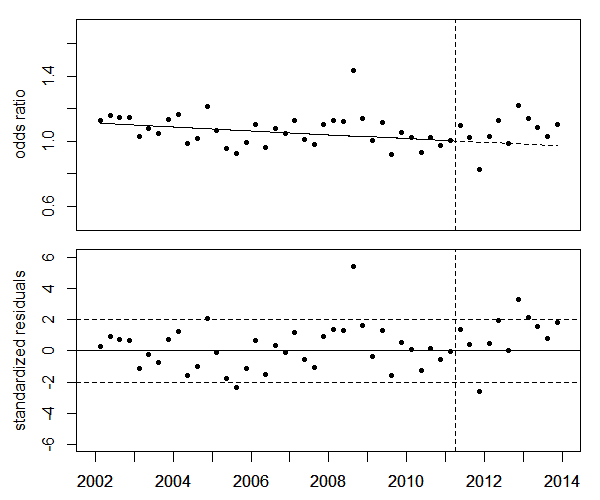
Upper panel: Ratios of perinatal mortality rates in the study region to the rates in Japan minus the study region (odds ratio). Lower panel: Deviations of odds ratios from the trend, in units of standard deviations (standardized residuals).
In a next step, the study region is divided into a more contaminated region
(Fukushima and 4 adjacent prefectures) and a less contaminated region
(Iwate, Chiba, Saitama, Tokyo). The increases in 2012-13 and in the third
quarter of 2008 are estimated by dummy variables d1213 and Q3, respectively.
The regression results are shown in the follwowing table.
|
5 more contaminated prefectures |
4 less contaminated prefectures |
|||||||
|
parameter |
estimate |
SE |
t value |
p value |
estimate |
SE |
t value |
p value |
|
(Intercept) |
0.1719 |
0.0457 |
3.760 |
0.0005 |
0.1138 |
0.0339 |
3.356 |
0.0016 |
|
t |
-0.0154 |
0.0065 |
-2.388 |
0.0213 |
-0.0099 |
0.0047 |
-2.118 |
0.0399 |
|
Q3 |
0.2432 |
0.1205 |
2.018 |
0.0497 |
0.3629 |
0.0848 |
4.280 |
0.0001 |
|
d1213 |
0.2113 |
0.0649 |
3.257 |
0.0022 |
0.0627 |
0.0471 |
1.330 |
0.1902 |
In the more contaminated prefectures (Fukushima, Miyagi, Gunma, Tochigi,
Ibaraki) the regression of the odds ratios yields a significant 23% increase
in 2012-2013 (P=0.0022) which translates to 130 excess perinatal deaths
(O=802, E=672).
In the four less contaminated prefectures (Iwate, Chiba,
Tokyo, Saitama) there is a 6.5% increase in 2012-13 (P=0.190). Although not
statistically significant, this increase corresponds to 113 excess perinatal
deaths in 2012-2013 (O=1762, E=1649).