Infant mortality
The trend of infant motality shows monthly variations which are accounted for by 11 dummy variables for February through December (January is the reference month). A highly significant peak is found in March 2011 at the time of the earthquake and tsunami. In the first 9 months of 2012, all data points are higher than the extrapolated trend of the data before March 2011 (see figure below).
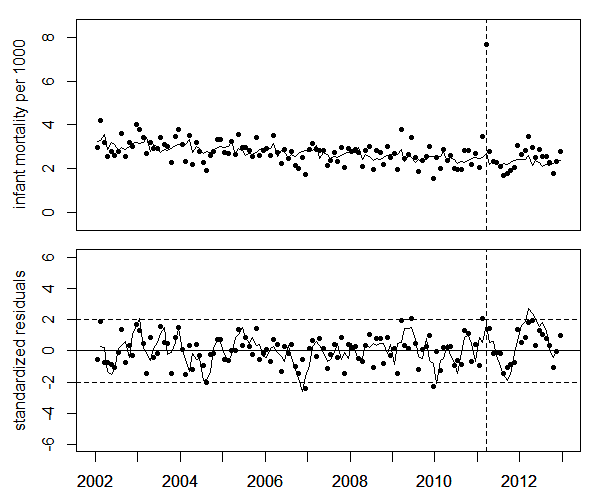
Upper panel: Infant mortality in the study region near Fukushima and trend line. Lower panel: Deviations of infant mortlity from the trend, in units of standard deviations (standardized residuals), and 3-month moving average (solid line).
To test the significance of the increase of
infant mortality in 2012, the ratio of infant mortality rates in the study
region to the rates the Japan minus the study region (odds ratios) is
analyzed. The regression yields a 16.3% increase in 2012 (P=0.017). This
corresponds to 53 excess infant deaths in 2012.
A regression with dummy variables for
the 4 quarters of 2012 improves the goodness of fit. The excesses in the 4
quarters are 26% (P=0.037), 23%
(P=0.067), 24% (P=0.061) and -5.7%(P=0.616), respectively (see figure
below).
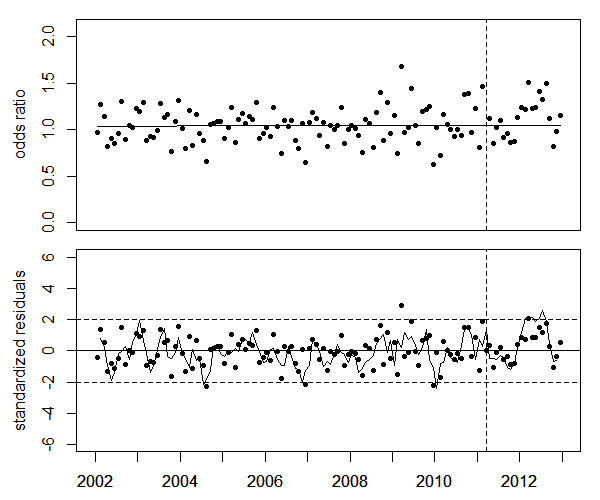
Upper panel: Ratios of infant mortality rates in nthe study region to
the rate in Japan minus the study region (odds ratio). Lower panel:
Deviations of odds ratios from the trend, in units of standard deviations (standardized residuals),
and 3-month moving average
(solid line).
read more: Strahlentelex February 2014
Update: Infant mortality after Fukushima