Infant mortality in Poland
Poland which has borders with Belarus and Ukraine is likely to be more contaminated from the Chernobyl fallout than Germany. In addition, Poland has a rather large population of nearly 40 mio. Data from Poland may support the findings of increased perinatal mortality data in Germany.
Unfortunately I could not get monthly data of perinatal mortality from Poland. Therefore monthly data of infant mortality, 1981 through 1991, were used.
Data evaluation
For the data analysis, a non-linear regression model is applied (statistical package R, function nls):
fm <- nls(p~1000/(1+1/exp(c0+c1*x+c2*cos(2*pi*(x-c3))+c4*cos(2*pi*(2*x-c5))+c6*cs+c7*cs^2)),
where
x is time where x=t-1980 and t is calendar year.
To allow for seasonal changes, two periodic terms with periods of 6 and 12 months
are introduced (parameters c2-c5). cs(x) are monthly averages of the caesium burden of women during
pregnancy from consumption of cow milk, delayed by seven months.
Regression results
The
model fit to the data shows large overdispersion (SSE=332.2; df=124, dispersion
parameter OD=2.68). Therefore a regression for a restricted time interval,
1985-1989, was conducted. It yielded SSE=80.2; DF=52; OD=1.54.
The following table contains the parameter estimates and the respective p values.
| parameter | estimate | SE | t-value | p-value |
| c0 | -3.6035 | 0.0268 | -134.3 | 0.0000 |
| c1 | -0.0342 | 0.0037 | -9.21 | 0.0000 |
| c2 | 0.0332 | 0.0076 | 4.378 | 0.0001 |
| c3 | 0.0344 | 0.0345 | 0.997 | 0.3233 |
| c4 | 0.0639 | 0.0071 | 9.003 | 0.0000 |
| c5 | 0.8007 | 0.0176 | 45.56 | 0.0000 |
| c6 | -0.2608 | 0.2254 | -1.157 | 0.2527 |
| c7 | 1.9611 | 1.0112 | 1.939 | 0.0579 |
The linear caesium term
has a negative sign, the quadratic term a positive sign.
The
combined effect of the linear and the quadratic caesium terms is not significant
(p=0.014; F-test).
A regression with only a
linear caesium term yields p=0.0245.
Thus
infant mortality in Poland - like perinatal mortality in Germany - is associated
with the delayed caesium burden of pregnant women.

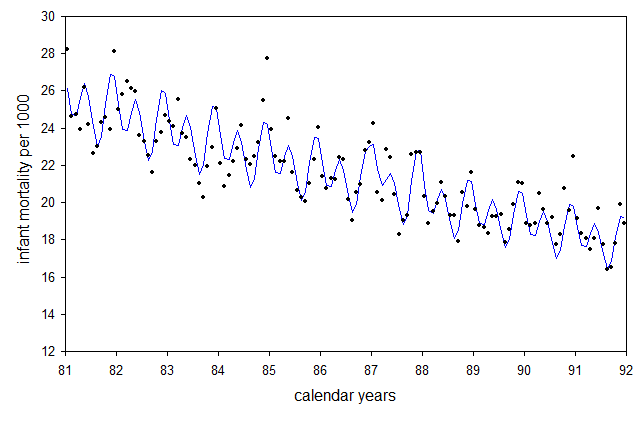
Fig.1:
Monthly data of infant mortality in Poland, 1981-1991,
and secular trend (blue line).
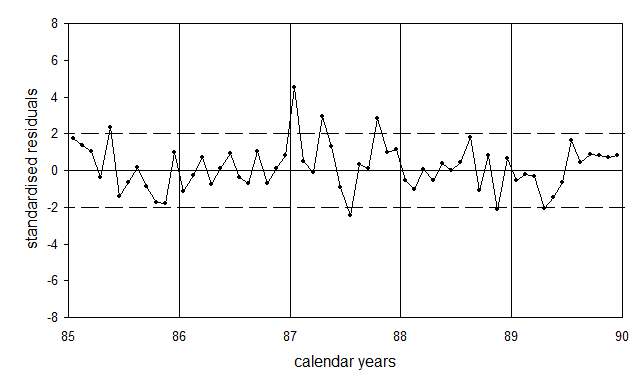
Residuals
Figure 2 shows the residuals, ie the deviations of the data from the model fit, in units of standard deviations (standardised residuals). In January 1987 and in April 1987 infant mortality rates are significantly increased.

Fig.2:
Residuals of infant mortality rates in Poland, 1985-1989. The
broken lines indicate the range of two standard deviations.
Dose-response relationship
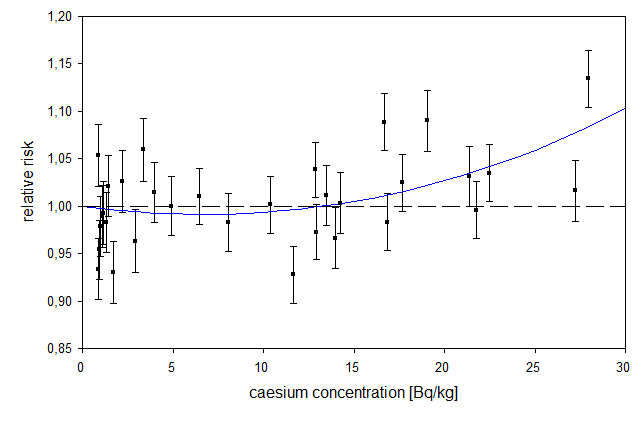
Figure 3 displays the association between infant mortality and delayed caesium burden. The y-axis shows the ratio of observed to expected infant mortality rates (relative risk).

Fig.3: Ratio
of observed to expected infant mortality rates (relative risk) as a function of
the delayed caesium burden of pregnant women. The blue line is the result of a
regression with a linear-quadratic model. The error bars are standard deviations.