Congenital
malformations
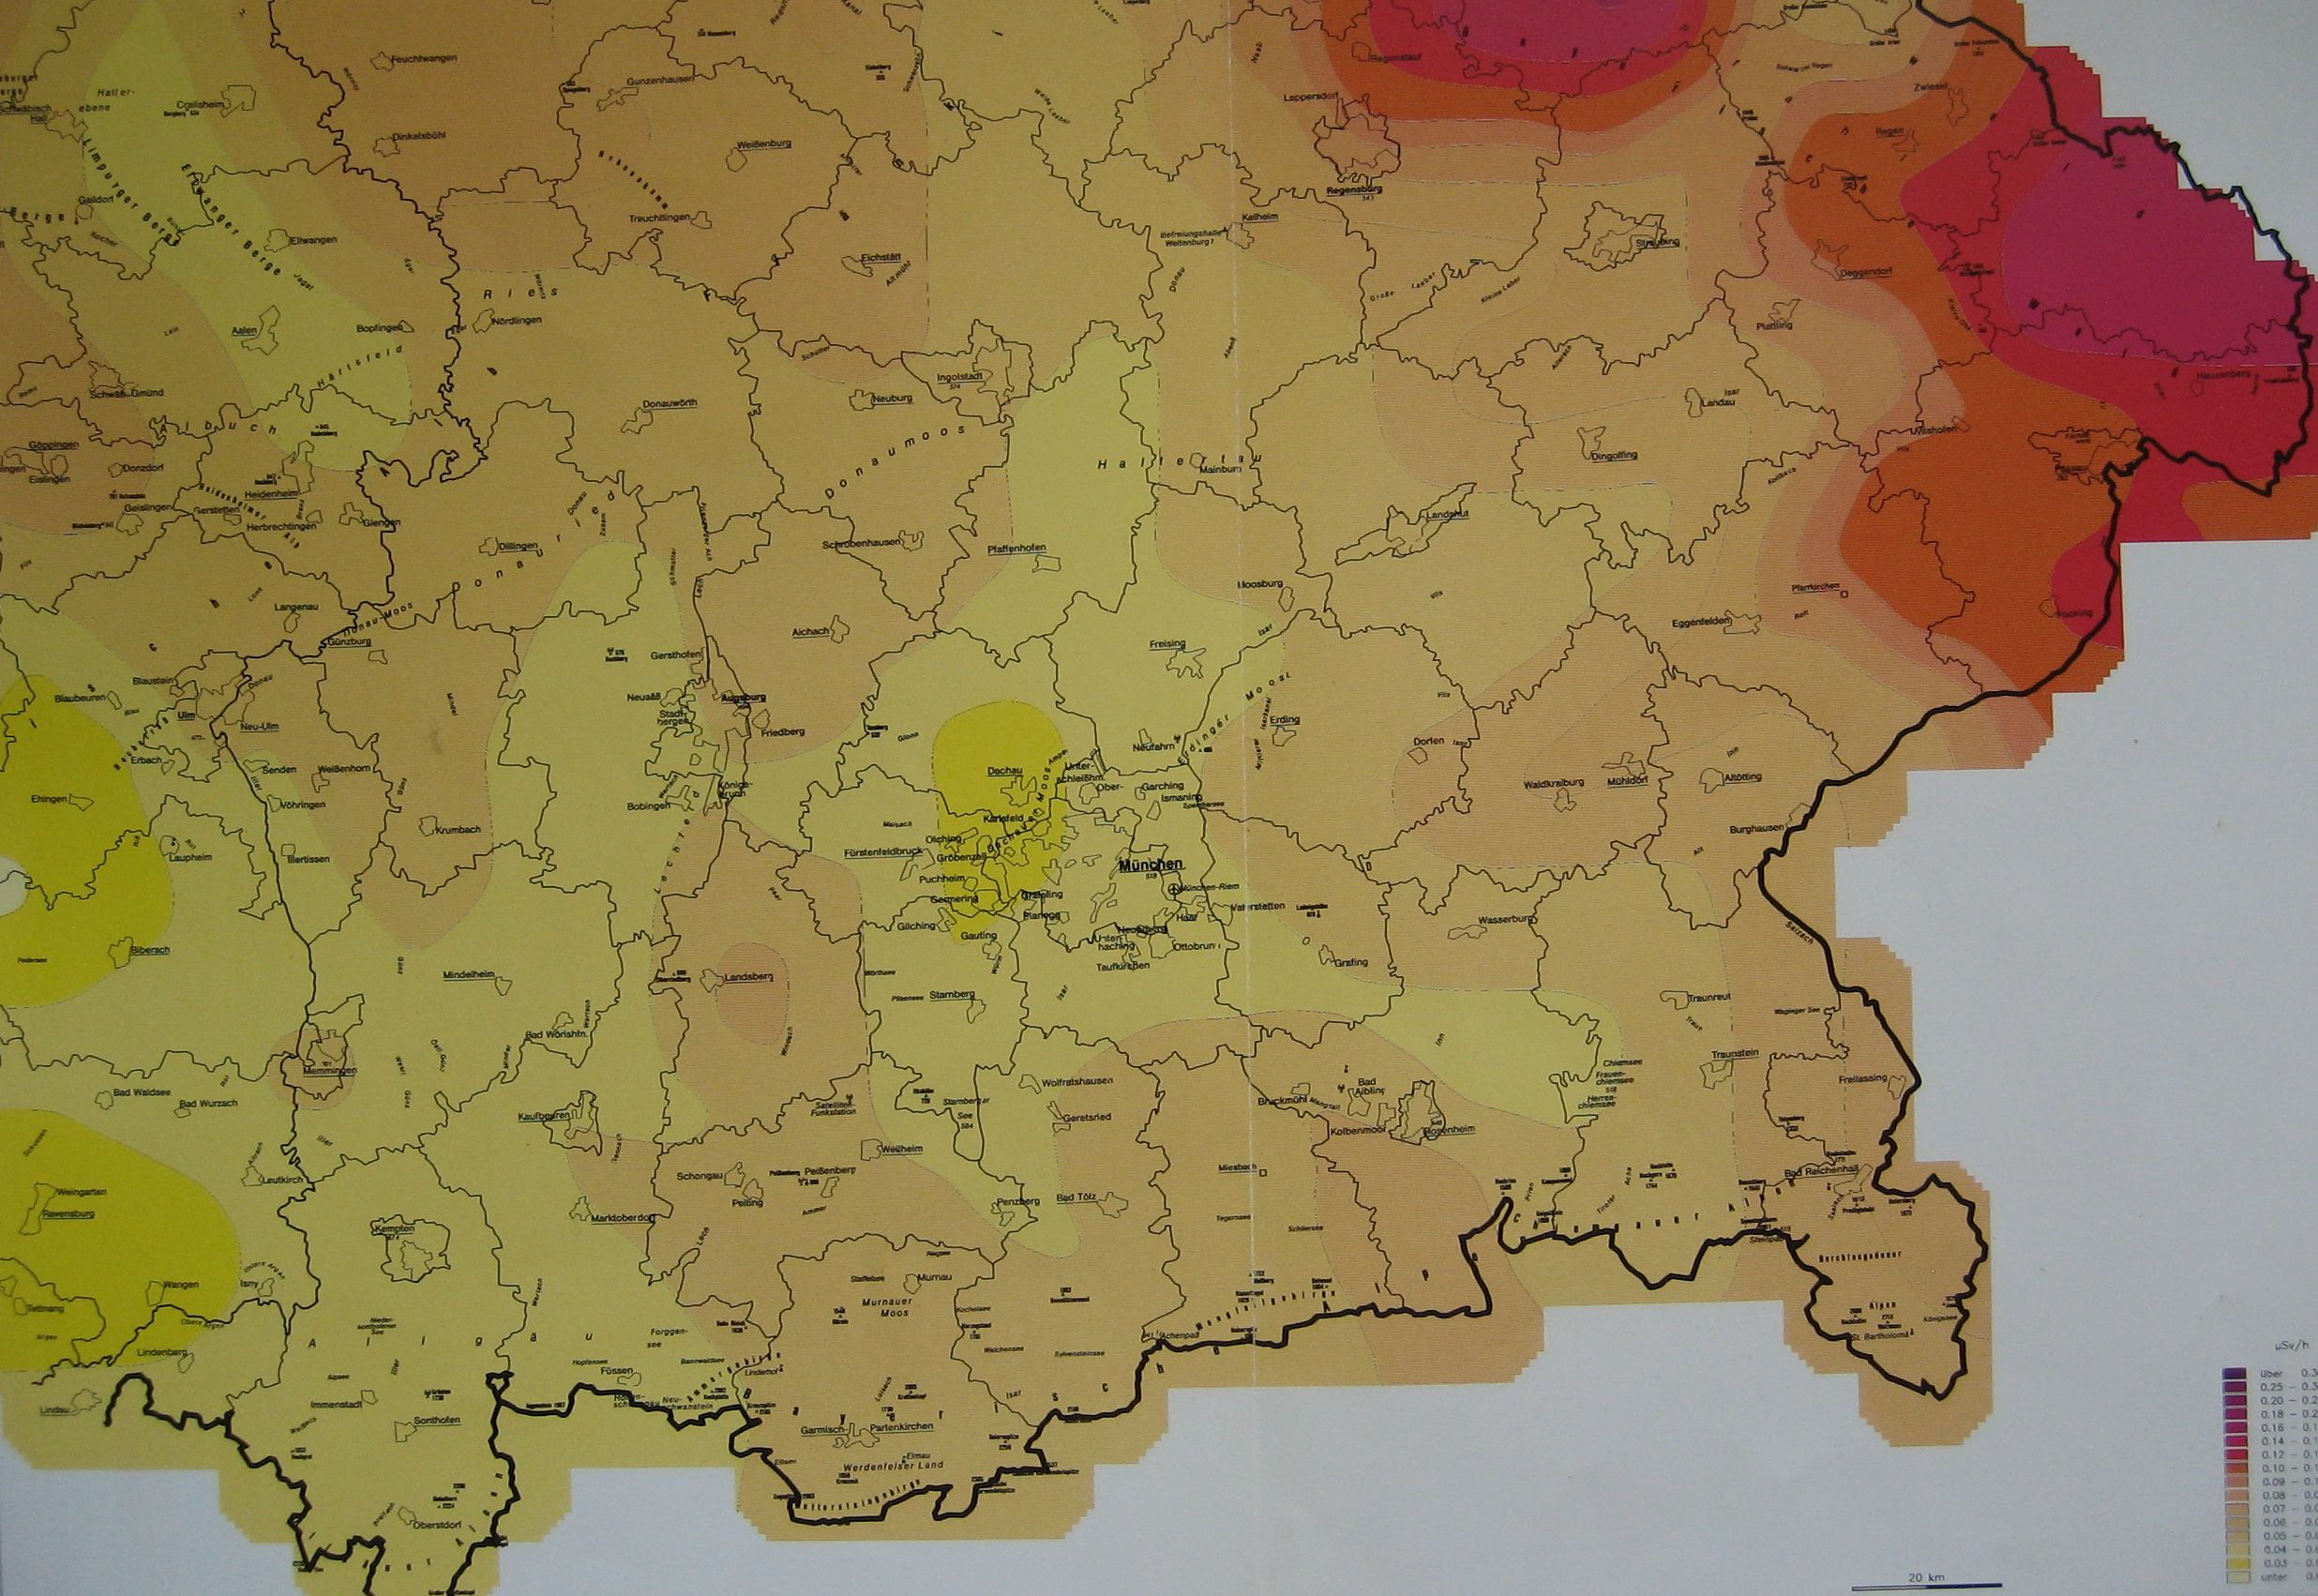
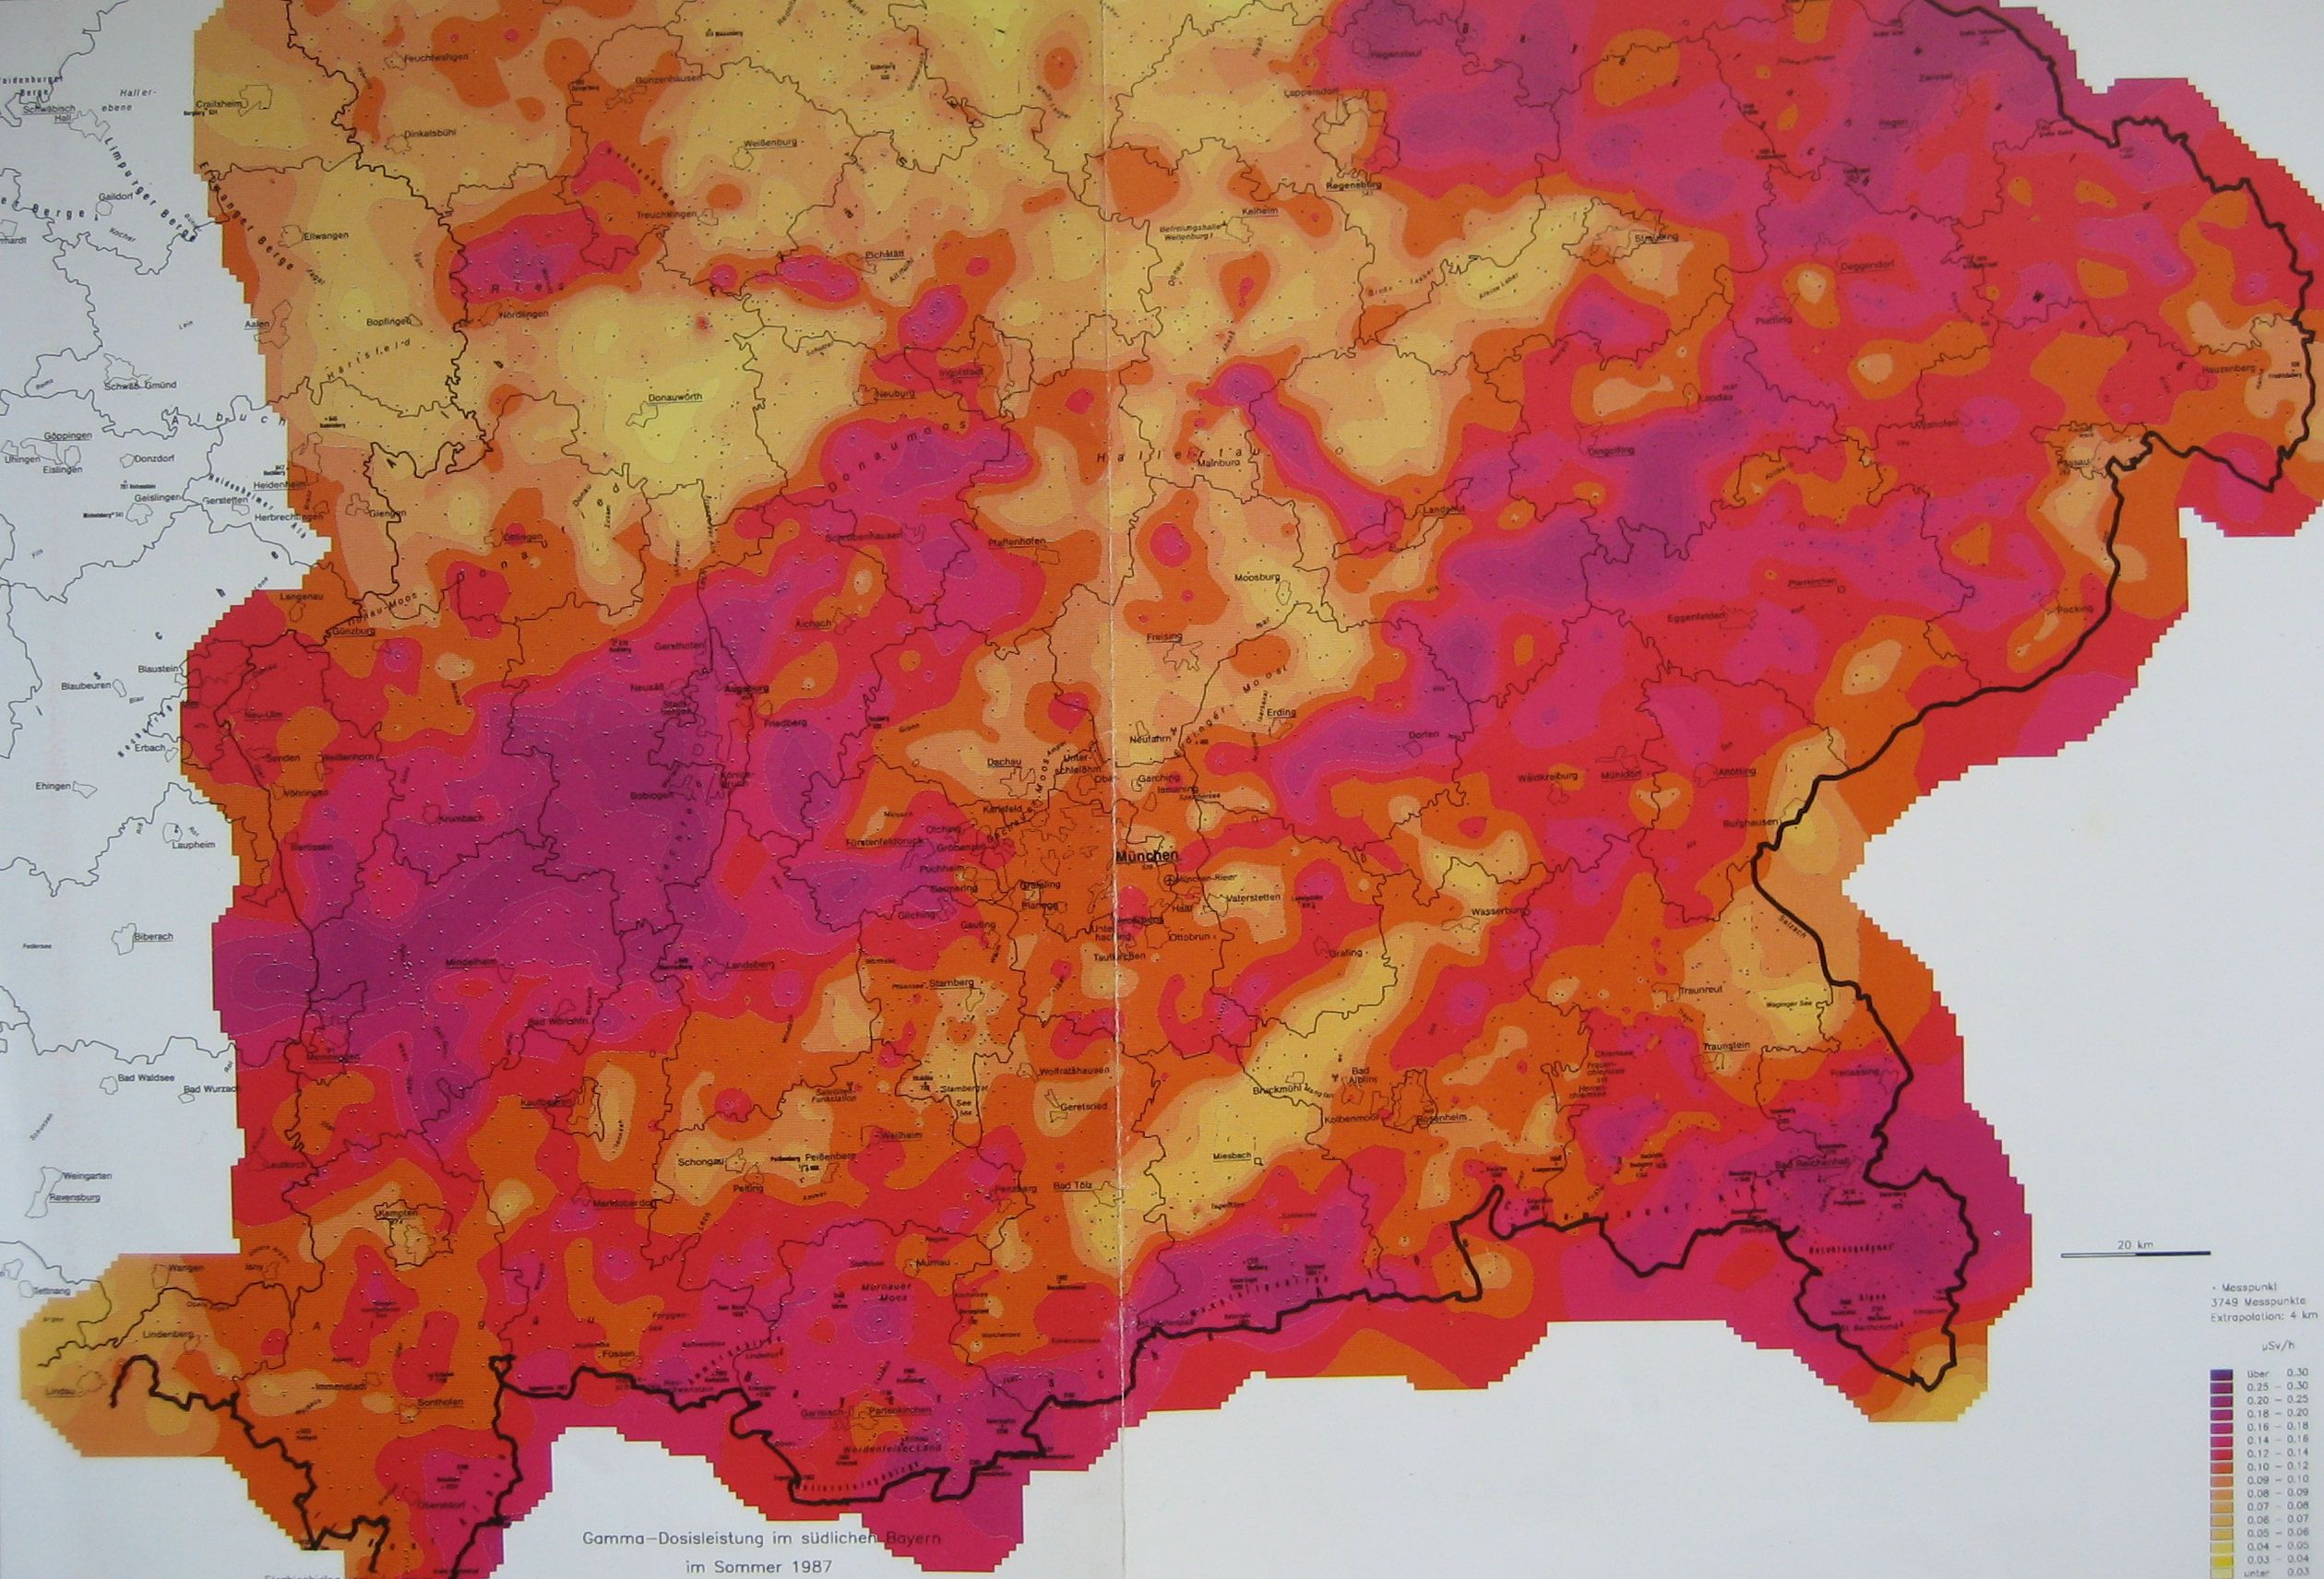
Gamma
background radiation in southern Bavaria before (upper image) and after (lower
image) Chernobyl
(from: E. Lengfelder. Strahlenwirkung, Strahlenrisiko. ecomed
verlagsgesellschaft (1990) ISBN 3-609-63260-7)
Data
of the prevalence of malformations at birth, 1984-1991, were collected a
posteriori in Bavarian maternal hospitals after Chernobyl by order of the
Bavarian Environmental Ministry. Bavaria was the German federal state with highest radiation exposure from Chernobyl.
Each
case was recorded with diagnosis, sex, day of birth and residence of the mother.
Out of a total of 29,961 newborn with malformations, only 7,171 cases were
considered appropriate for evaluation; the others were excluded for different
reasons by the German Federal Office of Radiation Protection (Bundesamt für
Strahlenschutz, BfS). This data set was provided by BfS for
evaluation.
Data
for the caesium-137 soil contamination on a district level (96 districts) were
also obtained from BfS. Daily measurements of the caesium concentration
in cow milk in Munich from May 1986 until the end of 1988 were provided by the
state supported Society for Environment and Health (Gesellschaft für Umwelt
und Gesundheit, GSF).
An official study, conducted by the German Federal Office of Radiation Protection (Bundesamt für Strahlenschutz, BfS), found no significant difference in malformation rates between the higher exposed southern part of Bavaria and the less contaminated northern part following Chernobyl. A trend analysis of the state-wide Bavarian malformation rates, 1984-1991, does not show an appreciable deviation in 1987 from the trend of the other years. If anything, there is a non-significant 3.5% reduction relative to the long-term trend. This result actually agrees with the widely accepted concept of a threshold dose for teratogenic effects.
Malformation rates in Bavaria (dots) and three-month moving average
(solid line). The broken line is the undisturbed trend.
Ratio of malformation rates in southern and northern Bavaria
Following
the BfS-approach, the malformation rates in southern Bavaria are compared
with the rates in northern Bavaria. In southern Bavaria (regions Oberbayern,
Niederbayern, Schwaben) the population weighted average caesium soil
contamination was about 4-times higher than in northern Bavaria (regions Oberpfalz,
Oberfranken, Unterfranken, Mittelfranken).
To
study the ratio of malformation rates in southern Bavaria to the rates in
northern Bavaria, odds ratios (OR) are calculated which are defined by
OR
= (M1/(LB1-M1)) / (M0/(LB0-M0))
with
M1 M0
number of malformed
infants in southern / northern Bavaria
LB1 LB0
number of live births in southern / northern Bavaria.
A
weighted linear regression of the logarithms of the odds ratios is performed
with weights
sigma²
= 1/M1 + 1/(LB1-M1) + 1/M0 + 1/(LB0-M0).
Figure 27 shows the odds ratios and the result of the regression (broken line). The odds ratios are markedly increased in November and December 1987; the 3-month moving average (solid line) exhibits a peak just seven months after the second peak of caesium concentration in pregnant women in April and May.
Ratios of malformation rates in southern to northern Bavaria (odds ratios)
and three-month moving average (solid line). The broken line is the undisturbed
trend.
Extended caesium term
In
the above calculation, the time development of the caesium concentration in
pregnant women was based on the consumption of cow milk only. One reason was
that systematic caesium measurements were not available for other foods. Also,
nearly one half of the milk consumed in West Germany is produced in Bavaria. Therefore it seemed acceptable to neglect other foods.
In
Bavaria, where the average fallout was considerably higher than in the rest of
Germany, not only milk but other foods from local production were considerably
contaminated after Chernobyl. In 1986, GSF published a dose prognosis
that was based on calculated caesium concentrations in four main food components
(milk, beef, pork, and cereals).
For
a refined calculation of the caesium burden in pregnant women I used the caesium
concentration in these foods after scaling them with the measured caesium
concentration in cow milk. The respective annual consumption rates are published
in the German regulations of radiation protection. For cereals I assumed that
only 50% came from local producers.
The result of the calculation are shown in the following figure. Again there are two peaks of caesium burden in pregnant women, one in June/July 1986, a second in April/May 1987. A comparison with the old caesium term shows that now the second peak is higher than the first peak.
Calculated
caesium concentration in pregnant women after Chernobyl.
The light columns represent the contribution from cow milk, the dark columns are
the contributions from beef, pork, and cereals combined.
Association
with caesium burden of pregnant women
To
investigate whether there is an association between odds ratios and the delayed
caesium burden of pregnant women, a trend analysis of the logarithms of the odds
ratios is performed with a linear-quadratic form of the caesium term which
allows for a non-monotonous dose response curve:
ln(OR)
= β1 +β2·t +β3·cs7(t) +β4·cs7(t)².
Here
cs7(t) is the delayed new caesium concentration in pregnant women (time lag 7
months) that contains the contributions from beef, pork, and cereals in addition
to cow milk.
The
regression gives a weighted sum of squares of χ² = 102.4 (df=92),
significantly less than χ² = 111.3 (df=94) which is obtained without the
caesium terms (p=0.0213, F-test). The results are listed in the following table.
Results of trend analysis to odds ratios of malformation rates from Bavaria
|
parameter |
estimate |
SD |
t-value |
p-value |
|
β1 |
0.1096 |
0.0959 |
1.1424 |
0.1281 |
|
β2 |
-0.0151 |
0.0111 |
-1.3666 |
0.0875 |
|
β3 |
-0.2229 |
0.1002 |
-2.2241 |
0.0143 |
|
β4 |
0.0845 |
0.0328 |
2.5789 |
0.0057 |
The linear caesium term is negative (p=0.014), the quadratic term is positive
(p=0.006). A regression with only the linear caesium term yields χ² =
109.8 (df=93) which compares to χ² = 102.4 (df=92) for the
linear-quadratic model. The difference of sum of squares is significant
(p=0.011, F-test), i.e., the dose-response relationship has a curvilinear shape.
The figure below shows the odds ratios as a function of the caesium burden of
pregnant women and the result of the above regression with a linear-quadratic
caesium term.
Odds
ratios of malformation rates in southern vs. northern Bavaria as a function of
caesium concentration in pregnant women,
and result of a regression with a linear-quadratic model for the caesium effect.
Regressions
with time-lags of 6 and 8 months yield sum of squares of 108.1 and 107.3,
respectively. Both values are significantly greater than χ² = 102.4; thus
7 months is the best estimate for the time lag.
Association with caesium soil contamination
Malformation rates in November and December 1987 are nearly two times greater in southern Bavaria than in northern Bavaria. Since information on malformation rates and on average caesium soil contamination was provided on a district level (96 districts), a linear regression of malformation rates in November plus December 1987 on caesium soil contamination is performed. The results are displayed in the following figure. Each of the 4 data points represents the average of 24 districts (black squares), the solid line is a linear fit. The white squares are the combined November plus December rates in the remaining years, i.e., in 1984-1986 plus 1988-1991.
Malformation rates in Bavaria in November plus December 1987 as a function of caesium-137 soil contamination (black squares), and regression line. Each data point represents 24 districts. The white squares are the corresponding rates in the remaining years.
ln(OR) = ln(β1 +β2·cs(k))
Here
cs(k) is the average caesium soil contamination in district group k, where 6
districts are pooled into one group, i.e., k=1..16.
The model fits the data well; the sum of squares is 13.9 with 14 degrees of freedom. The estimates for the parameters are β1 = 0.47 ± 0.17 and β2 = 0.034 ± 0.011. The increase of malformation rates with caesium contamination is significant (p=0.0035). The next figure shows the odds ratios and the regression line.
Odds ratios (OR) of malformation rates in Bavaria in November plus December 1987 as a function of caesium-137 soil contamination and regression line. Each data point represents 6 districts. The error bars show 1 standard deviation. Mind that most OR below 20 kBq/m² are <1 while all OR above 20 kBq/m² are >1.
Combined spatial-temporal trend analysis
In the two preceding sections, both the temporal trend and the spatial distribution of malformation rates were analysed. When I discussed the results with Prof. H. Küchenhoff, Institute of Statistics, University of Munich, he proposed to conduct a combined spatial-temporal analysis of monthly malformation rates which was then performed by one of his students. The monthly malformation rates in the 96 Bavarian districts and in 96 months (1984-1991) were analysed as a function of place and time. A modified caesium term cs(k,t) was introduced, defined as the product of the caesium soil contamination cs(k) in district k (k = 1 to 96) and the caesium concentration cs(t) in pregnant women as a function of time t. A linear-quadratic regression model was applied which allowed for a nonmonotonic dependency of malformation risk on the cesium term cs(k,t). The regression yielded a dose-response characterised by a decrease with caesium concentration at low values of the caesium term, and a rather steep increase at higher values (p=0.0152, F-test).