Perinatal
mortality in Belarus
The
region (oblast) of Gomel is the area with highest fallout in Belarus. Whereas
little strontium in the Chernobyl fallout was measured in Munich (210 Bq/m²
Sr-90 compared to about 20,000 Bq/m² Cs-137, May 1986), the strontium soil
contamination in parts of Gomel oblast outside the 30-km exclusion zone exceeded
37,000 Bq/m² in 1986.
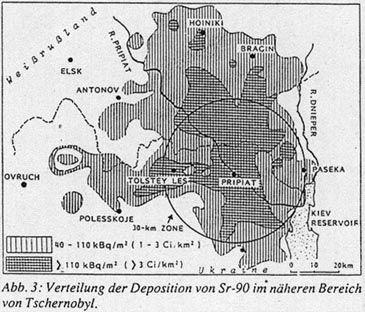
Strontium-90 soil contamination near the
Chernobyl reactor site (from German journal Atomwirtschaft,
March 1991). The hatched areas indicate strontium concentrations greater than 1
Ci/km² (37 kBq/m²) and 3 Ci/km² (111 kBq/m²), respectively. The circle is
the 30-km evacuation zone.
The
trend of perinatal mortality rates, 1985-1998, in the oblasts of Gomel,
Minsk-City, and in Belarus minus Gomel and Minsk-City are displayed in the next
figure. In 1994 there is a 20% increase of perinatal mortality in all three data
sets which is a consequence of a change of definition of stillbirths. Perinatal
mortality data from the City of Minsk do not conform with the data in the rest
of Belarus. The rates from Minsk-City are consistently higher than in the rest
of Belarus until after 1995 when they suddenly drop by 50%. No such decrease
occurs in the other regions of Belarus, i.e. the peculiarity in the City of
Minsk, the capital of Belarus, is not likely to have biological reasons.
Therefore the data for the City of Minsk were not included ih the control area
(Belarus minus Gomel and the City of Minsk).
Perinatal mortality rates in Gomel, Minsk-City, and Belarus minus Gomel and Minsk-City. The offset in 1994 results from a definiton change of stillbirths.
A trend analysis of perinatal mortality data is problematic for two reasons.
First - like in most European countries - the definition of stillbirth was
changed at the end of 1993. Second, possible socio-economic problems after the
break-up of the Soviet Union in 1991 might have had an influence on the trend of
perinatal mortality rates. Assuming that these influences acted equally in the
study and the control region, a possible effect of the radiation exposure should be
found in the ratio of perinatal mortality rates in Gomel oblast to the rates in
the control area.
Method
The ratio of perinatal mortality rate p1
in Gomel to the rate p0 in the control area can be expressed by the
odds ratio (OR) which is defined by
OR = (p1/(1-p1)) / (p0/(1-p0)).
A weighted regression of the logarithms of
the odds ratios is performed with the model
(5.1) ln(OR) = β0 +β1·d87 +β2·sr(t)
where parameter β0 allows for
a difference in the base line perinatal mortality rates in the study and the
control area, β1 estimates the caesium effect in 1987 (dummy
variable d87) and β2 estimates the possible effect of
strontium on the data.
The expression sr(t) is the average strontium
concentration in pregnant women, calculated under the assumption that strontium
is mainly incorporated at the end of the period of menarche, the time of maximum
bone growth, at about age 14. For a given year following Chernobyl, the
average strontium concentration is approximated by the percentage of pregnant
women who were 14 years old in 1986, i.e. who were born in 1972. This percentage
follows from the maternal age distribution. In Belarus, maternal age
distributions were only available in 5 year strata (see figure below). The
shaded areas represent the average age distribution in Belarus for 1992-1996. To
get approximated yearly values, a superposition of two lognormal distributions
was used to fit the step function.
Maternal age distribution in Belarus, averaged for 1992-1996, and
interpolation curve using two superimposed lognormal distributions.
Second, the strontium excretion from the body
must be considered in the calculation of sr(t). According to the ICRP
Publication 67, the strontium excretion cannot be described by a simple
exponential decrease, but is composed of a fast and a slow component. Thus, the
strontium term sr(t) in year t after Chernobyl has the form
sr(t)
~ F(t-1972)·(A1·exp(-ln(2)·(t-1986)/T1)+A2·exp(-ln(2)·(t-1986)/T2))
where
F(t-1972) is the fraction of pregnant women born in 1972. T1=2.4
years and T2=13.7 years are effective half-lives of strontium in the
female body. The constants A1, A2 and the half-lives T1,
T2 were determined from a regression of tabulated values given in
ICRP publication 67.
For the regression the data are population
weighted with weights
var
= 1/n1 + 1/(N1-n1) + 1/n0 + 1/(N0-n0)
where
n1 and n0 are the number of perinatal deaths in the
study(1) and control(0) area and N1, N0 the corresponding
numbers of live births.
To test the significance of the parameters,
two-sided t-test are applied (H0: β1=0, β2=0).
Results
To
determine the age of maximum strontium uptake from the data, regressions with
strontium terms for maximum strontium uptake at age 13, 14, and 15 are performed.
The results for the sums of squares are 9.7, 7.3 and 9.9, respectively. Thus the
strontium term with an age of 14 years for maximum strontium uptake fits the
data best.
The regression yields β0 = 0.022 ± 0.027, i.e., there is no appreciable difference in perinatal mortality
rates between study and control area before Chernobyl. The increase in 1987 is
not significant (β1=0.055 ± 0.060).
To determine the significance of
the strontium effect, the difference of the sum of squares resulting from
regressions without and with the strontium term is used. The corresponding sum
of squares are 29.7 (df=12) and 7.3 (df=10). The corresponding F-test is significant
(p=0.0028, F-test).
The figure below shows the observed (dots) and
expected odds ratios (solid line) resulting from a regression with β0=0
(see equation 5.1). In the beginning of the 1990’s, the odds ratios were
around 1.3, i.e., perinatal mortality rates in Gomel were 30% higher than in the
control area. The excess perinatal mortality rates in Gomel translate to 430
excess perinatal deaths, 1987-1998.
Odds ratios of perinatal mortality in Gomel vs. Belarus minus Gomel and
Minsk-City, and regression line.