The German KiKK study
In 2002 the German Radiation Protection
Agency (Bundesamt für Strahlenschutz, BfS) commissioned a
case-control study to investigate childhood cancers near nuclear power
plants. This so called KiKK study (Kinderkrebs um Kernkraftwerke)
was conducted by the German Childhood Registry (Deutsches
Kinderkrebsregister, DKKR) in Mainz.
The results of the KiKK study were presented in a technical report in
December 2007. At the same time, the results were published in two
scientific journals. The articles can be accessed in the web (see below).
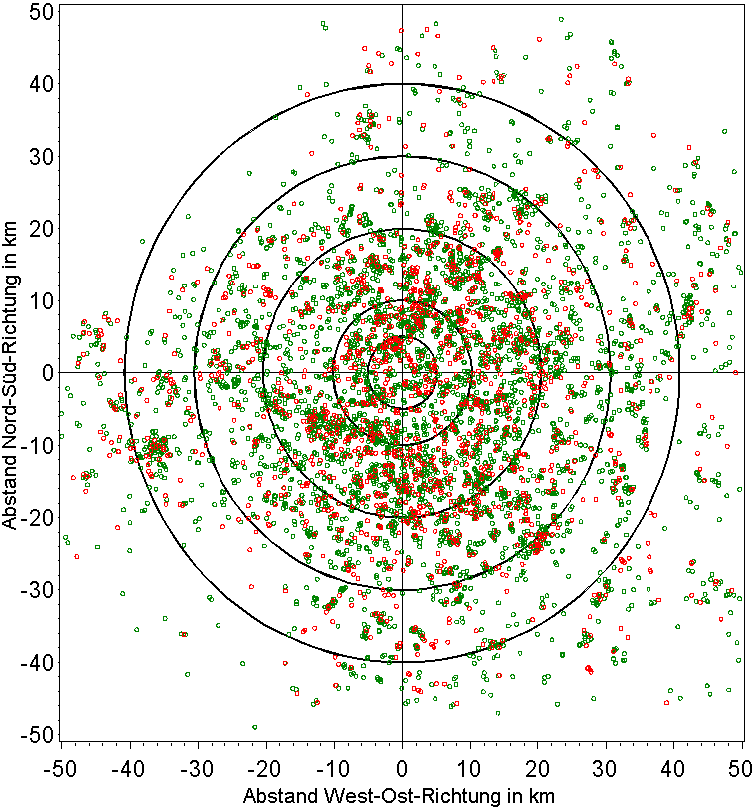
The polar diagram below (Fig.3.3 in KiKK study part 1) shows cancer cases (red) und controls (green) within 50 km distance from the nearest NPP site.

The KiKK report shows the following table (Table
3.14. part 1) containing the numbers of cases (Fälle, F) and
controls (Kontrollen, K) in 7 distance categories.
| r | F | K |
| 0-5 km | 77 | 148 |
| 5-10 km | 158 | 464 |
| 10-20 km | 523 | 1589 |
| 20-30 km | 403 | 1181 |
| 30-40 km | 225 | 726 |
| 40-50 km | 137 | 371 |
| > 50 km | 69 | 256 |
| Summe | 1592 | 4735 |

A logistic regression with model
ln(F/K)=beta0+beta1/r
yields the following results for the parameters beta0. beta1:
| parameter | estimate | SE | z-value | p-value |
| beta0 | -1,1581 | 0,0406 | -28,534 | <0,0001 |
| beta1 | 1,0477 | 0,4309 | 2,431 | 0,0150 |
SE:
Standard error of estimate
z-value: estimate divided by SE
p-value: two-sided p-value
The result for beta1 agrees with the result in Table 3.15 of the KiKK
study (1,18
+- 0,44; p=0,0034).
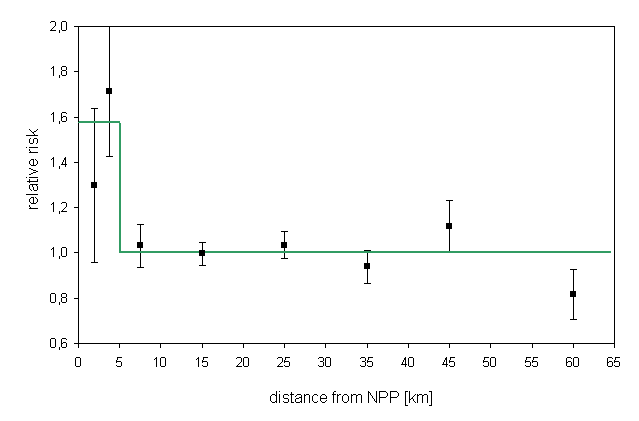
A better fit to the data is obtained with the following categorial regression model
ln(F/K)=beta0+beta1*d5km,
where
d5km is a dummy variable for the 5-km region (d5km=1 for
r<5km und d5km=0 for r>5km).
Die following Figure shows the relative risks (= odds ratios) in the individual distance zones and the regression result.

Leukemia
KiKK part 1 also contains results for leukemia cases. The numbers of cases (F) and controls (K), together with the harmonic means of the distances (r), are found in the article by Kaatsch et al. for 6 distance zones.
| r | F | K |
| 3.09 | 37 | 54 |
| 7.62 | 58 | 173 |
| 17.79 | 332 | 1048 |
| 37.45 | 135 | 387 |
| 56.98 | 27 | 92 |
| 73.59 | 4 | 12 |
| Summe | 593 | 1766 |
Regressions with the following 5 models are conducted:
Model
1: ln(F/K) = beta0 + beta1/r
Model 2: ln(F/K) = beta0 + beta1/r + beta2/r^2
Model 3: ln(F/K) = beta0 + beta1/r^2
Model 4: ln(F/K) = beta0 + beta1/r + beta2*d5km
Model 5: ln(F/K) = beta0 + beta1*d5km
dummy-variable d5km is 1 for r < 5 km and 0 for r > 5 km
Model information:
| DF | SSE | AIC | |
| model 1 | 4 | 3.3148 | 39.538 |
| model 2 | 3 | 0.7197 | 38.943 |
| model 3 | 4 | 1.2925 | 37.516 |
| model 4 | 3 | 0.9244 | 39.148 |
| model 5 | 4 | 0.9260 | 37.149 |
DF
= degrees of freedom
SSE = sum of squares (deviance)
AIC = AIC criterion of the goodness of fit
The following table shows the parameter estimates and standard errors (SE)
resulting from the 5 regressions:
|
Parameter |
estimate | SE | z value | P value |
| Model 1 | ||||
| beta0 | -1.2393 | 0.0695 | -17.84 |
0.0000 |
| beta1 | 2.2113 | 0.7387 | 2.994 | 0.0028 |
| Model 2 | ||||
| beta0 | -1.0600 | 0.1310 | -8.092 | 0.0000 |
| beta1 | -2.1110 | 2.7950 | -0.755 | 0.4501 |
| beta2 | 13.061 | 8.1320 | 1.606 | 0.1082 |
| Model 3 | ||||
| beta0 | -1.1511 | 0.0512 | -22.469 | 0.0000 |
| beta1 | 7.1316 | 2.1303 | 3.348 | 0.0008 |
| Model 4 | ||||
| beta0 | -1.1210 | 0.1032 | -10.858 | 0.0000 |
| beta1 | -0.0663 | 1.6631 | -0.040 | 0.9682 |
| beta2 | 0.7644 | 0.4980 | 1.535 | 0.1248 |
| Model 5 | ||||
| beta0 | -1.1247 | 0.0488 | -23.041 | 0.0000 |
| beta1 | 0.7466 | 0.2189 | 3.410 | 0.0006 |
Results:
-
Model 1 yields a significant regression coefficient beta1 (p=0.0028)
-
Model 2 (linear-quadratic model) yields a better fit than model 1. The sum of squares (SSE) is 0.720 which compares to 3.315 for the linear model, the corresponding values of AIC are 38.94 and 39.54. The estimate for the linear term is negative.
-
Model 3 (quadratic distance trend) fits the data better than the linear model (SSE=1.293, AIC=37.52).
-
Model 4 which allows for excess in the 5-km zone yields a negative regression coefficient beta1. This means that for r > 5 km the risk does not decrease with increasing distance from the NPP.
-
Model 5 which only allows for an excess in the 5-km zone yields the best fit to the data by the AIC criterion (AIC=37.15)
-
The RRs obtained with the linear model translate to 81 excess cases in the study zone (90% CI: 39-118), and to 34 excess cases (90% VB: 19 bis 47) with the quadratic model.
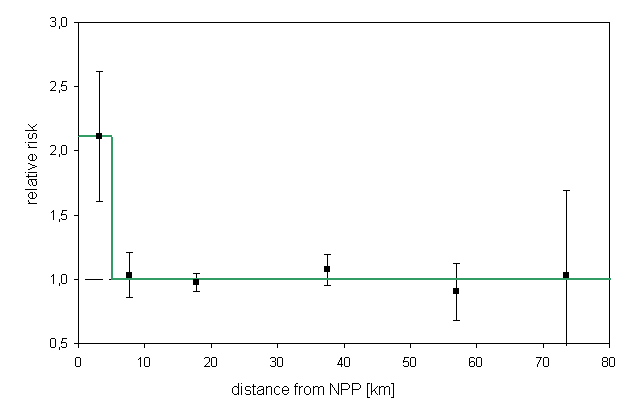
The following figure shows the relative risk (odds ratio) as a function of
distance from the NPP and the regression line with the categorial model (model
5).

References
Spix C. Schmiedel S. Kaatsch
P.
Schulze-Rath R. Blettner M. Case-control study on childhood cancer in the
vicinity of nuclear power plants in Germany 1980-2003. Eur J Cancer. 2008
Jan;44(2):275-84.
Abstract
download full article: PDF (569
kB)
Kaatsch P, Spix C, Schulze-Rath R, Schmiedel S, Blettner M. Leukaemia in young
children living in the vicinity of German nuclear power plants. Int J
Cancer. 2008 Feb 15;122(4):721-6. Abstract
download full article: PDF (309
kB)